What the Yield Curve Tells Us About Economic Expectations
The yield curve is a line linking interest rates across different maturities. Its shape is the market's summary of where rates, inflation and growth are heading.
Gajji Srinath, Founder, The Valuation Node
Key takeaways
- The yield curve plots government bond yields against maturity.
- Its shape reflects expected future short-term rates plus a premium for holding longer bonds.
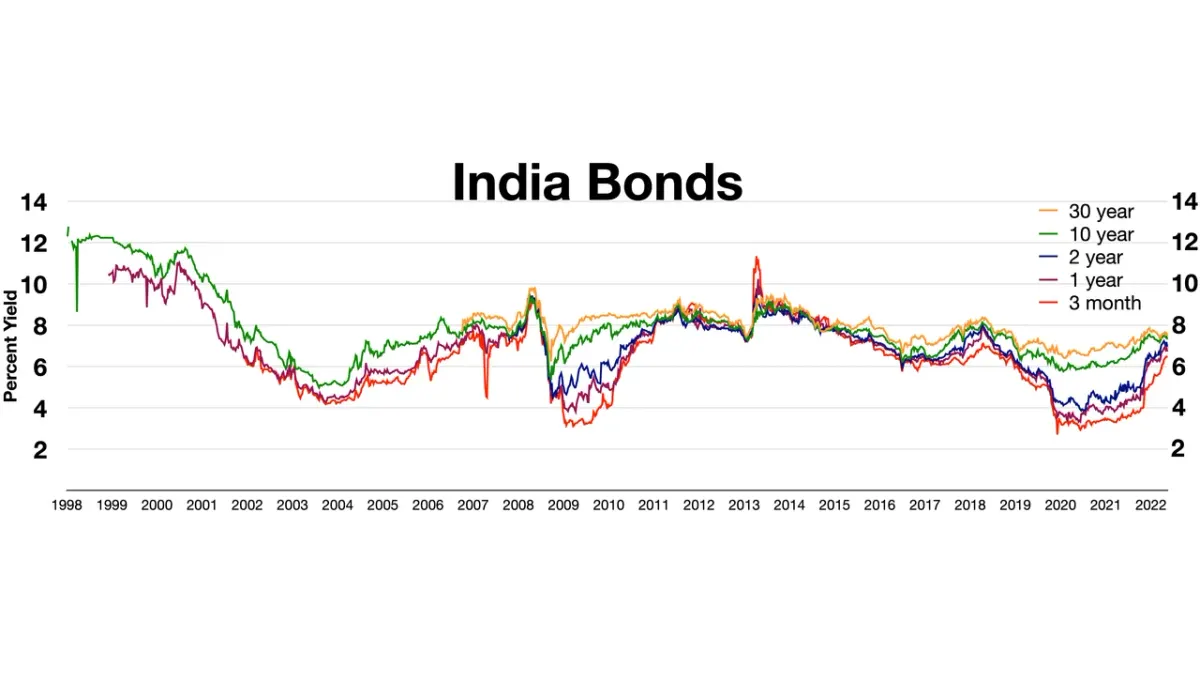
- In October 2026, India's curve was steep, signalling expected rate rises and inflation risk.
- In India, inverted curves are a weaker recession signal than in the US.
A Line With a Lot of Information
Plot the yields on government bonds of different maturities, from three months to forty years, and you get a line called the yield curve. It looks technical, but it holds a lot of information about what markets expect.
A borrower lending to the government for ten years instead of one wants to be paid for two things: what short-term rates are expected to be over those ten years, and the extra risk of tying up money for longer. The shape of the curve combines both.
Reading the Shape
- Upward sloping (normal). Long-term yields are higher than short-term ones. Markets expect rates to stay steady or rise, and want extra pay for longer bonds. This is the usual shape.
- Steep. Long-term yields are much higher than short-term ones. Markets often expect rate rises, higher inflation or heavy government borrowing.
- Flat. Yields are similar across maturities. Markets may expect rates to peak.
- Inverted. Short-term yields are higher than long-term ones. Markets expect rates to fall, often because they expect the economy to slow.
India's Curve in October 2026
In late October 2026, approximate levels were:
| Maturity | Measure | Approximate level |
|---|---|---|
| Overnight | RBI repo rate | 5.50% |
| 1 year | Overnight indexed swap | 6.55% |
| 2 years | Overnight indexed swap | 6.64% |
| 10 years | Government bond yield | 7.45% |
The curve was steep. One-year swap rates a full point above the repo rate meant markets expected more rate rises over the coming year. The 10-year yield, at its highest since March 2023, reflected concern about inflation, which had risen to 5.54% in September, about oil prices and about heavy bond supply. Higher US yields added pressure.
Reading Expected Rates From the Curve
Short-term market rates can be used to estimate what the market expects from the RBI. A one-year overnight indexed swap (OIS) is a contract that swaps a fixed rate for the average overnight rate over the next year. If the one-year OIS is about 6.55% while the overnight rate is close to the repo rate of 5.50%, the market is pricing an average overnight rate about one percentage point higher over the next twelve months. In other words, it expects further hikes.
This is a useful check on any forecast. If you expect the RBI to stop after one hike, you are betting against the market's pricing.
The Term Premium
Long-term yields are not just an average of expected short-term rates. Investors also want extra pay for the risk of holding a long bond: inflation could rise, the government could borrow more, or rates could move sharply. This extra pay is the term premium.
The term premium rises when uncertainty rises. In 2026, worries about oil, inflation and global bond markets pushed it up, which is one reason the 10-year yield rose further than short-term rates alone would explain.
Bond Prices Move Opposite to Yields
When yields rise, existing bonds lose value, because their fixed coupons are worth less than new bonds paying more.
Illustrative example. A 10-year government bond pays a 7% coupon. When market yields are 6.5%, it trades at about ₹103.6 per ₹100 of face value. If yields rise to 7.45%, its price falls to about ₹96.9, a loss of about 6.5%.
Longer bonds lose more for the same rise in yield. This is why bond funds, banks and insurers holding long bonds watch the curve closely.
Inversion Matters Less in India
In the US, an inverted yield curve has often come before recessions, and it is closely watched for that reason. In India, the signal is weaker:
- RBI liquidity operations can move short-term rates sharply, independent of growth expectations.
- Government borrowing plans strongly affect long-term yields.
- Regulated demand from banks, which must hold government bonds, and from insurers and pension funds, shapes the long end.
- Global index inclusion. Since June 2024, some Indian government bonds have been included in JP Morgan's emerging market bond index, bringing in foreign demand.
So the shape of India's curve reflects policy and plumbing as much as expectations.
Uses for Equity Investors
- Discount rates. The 10-year yield is the starting point for the cost of equity.
- Bank margins. A steeper curve can help banks that borrow short and lend long, though the speed of deposit repricing matters too.
- Rate-sensitive sectors. Expected rate rises hurt real estate, NBFCs and other borrowers first.
Habits for Reading the Curve
- Compare short-term rates with the repo rate to see what markets expect from the RBI.
- Watch the gap between 10-year and 2-year yields for changes in slope.
- Read the curve alongside inflation and government borrowing data.
- Check global yields, especially US Treasuries.
- Treat inversion in India as a question, not a forecast.
The Reframe
The yield curve is the bond market's forecast, written in prices. It is not always right, but it shows what investors are prepared to bet on, and that is worth knowing before making forecasts of your own.
Sources
Figures and claims come from the sources named in the text and in the methodology note above: company filings, exchange disclosures, and rating agency reports, as cited. See the editorial philosophy for how sources are chosen.
Cite this article
Gajji, S. (2026). "What the Yield Curve Tells Us About Economic Expectations." The Valuation Node. https://valuationnode.com/analysis/economic-analysis/what-the-yield-curve-tells-us
Related
How Crude Oil Prices Affect India's Inflation and Current Account
India imports nearly 89% of its crude. How oil prices flow into the current account, the rupee, inflation and the budget, and what 2026 showed.
MethodologyHow Rupee Depreciation Affects Indian Companies Differently
A weaker rupee helps some companies and hurts others. Four kinds of currency exposure, a worked example, and what to check in the notes.
MethodologyHow Interest Rates Influence Corporate Borrowing and Valuation
Rates reach companies through borrowing costs, discount rates, demand and the currency. Why the discount-rate effect is often the biggest for share prices.
Discussion
Commenting as a guest. Add a name if you like, or leave it blank to post as Anonymous. Log in to comment as yourself.
Educational analysis, not investment advice. The author may hold positions in securities discussed; where relevant, this is stated above. See the disclaimer.
Stay in the loop
Roughly one email per month. No spam, no upsells.