Terminal value dominates valuations, and why that should worry you
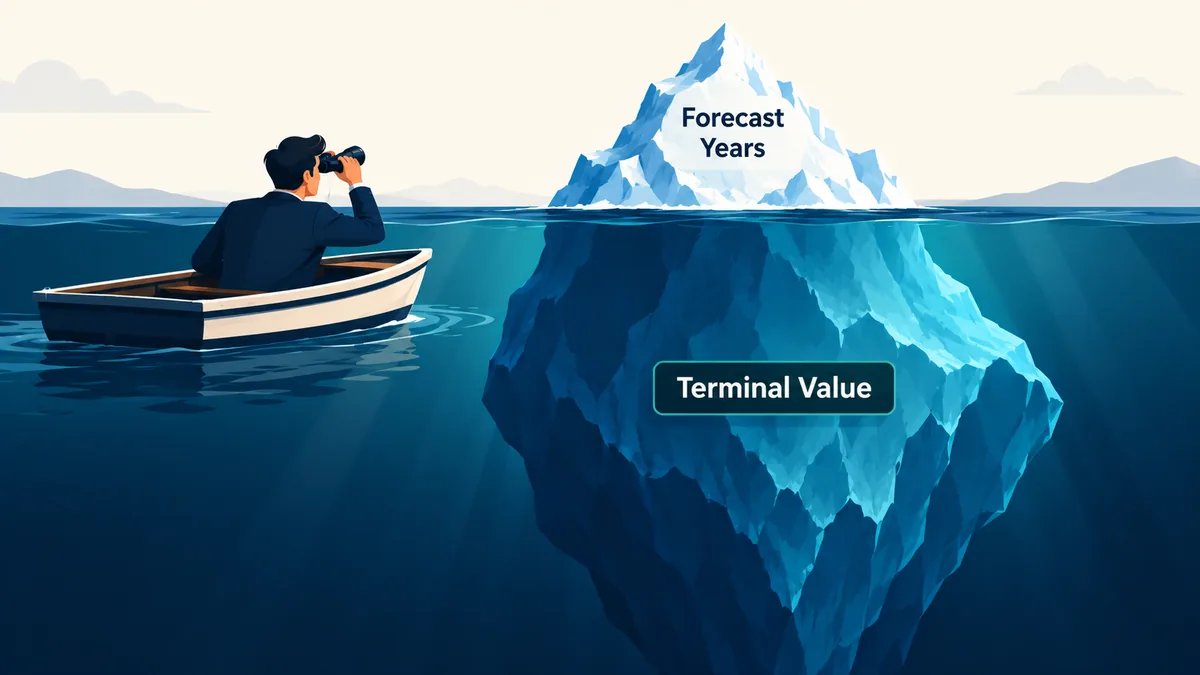
Analysts spend hours forecasting five years of cash flows, yet most of a DCF's answer usually comes from one number at the end. Here is why, and what to do about it.
Gajji Srinath, Founder, The Valuation Node
Key takeaways
- In a typical five-year DCF, the terminal value is most of the answer.
- A one-point change in WACC or terminal growth can move value by 10% to 17%.
- Terminal growth must be paired with the reinvestment needed to achieve it.
- Always report the terminal value's share and a sensitivity grid.
The comfort of a detailed forecast
Building a DCF model feels like careful work. You forecast revenue, margins, capex and working capital, year by year, for five years. All that detail creates a sense that the answer depends on it.
Often it does not. In a typical five-year DCF, most of the estimated value comes from a single number at the end: the terminal value. The years you forecast so carefully may explain only a quarter or a third of the result. The rest rests on two assumptions about the distant future.
That does not make the DCF useless. It does mean you should know where the value actually sits.
The arithmetic behind the dominance
A DCF values a company as the present value of its future free cash flows. Nobody can forecast forever, so the model forecasts a few years in detail and then sums up everything after that in one figure. The most common method is the perpetuity growth (Gordon growth) formula:
Terminal value = Free cash flow in the first year after the forecast ÷ (Discount rate - Terminal growth rate)
Illustrative example. A company generates free cash flow of ₹100 crore next year, growing 10% a year for five years. The discount rate, its WACC, is 12%. After year five, cash flow grows 5% a year forever.
| Year 1 | Year 2 | Year 3 | Year 4 | Year 5 | |
|---|---|---|---|---|---|
| Free cash flow (₹ cr) | 100.0 | 110.0 | 121.0 | 133.1 | 146.4 |
| Present value at 12% (₹ cr) | 89.3 | 87.7 | 86.1 | 84.6 | 83.1 |
- Present value of years 1 to 5: ₹431 crore
- Terminal value at the end of year 5: 146.4 × 1.05 ÷ (12% - 5%) = ₹2,196 crore
- Present value of the terminal value: ₹1,246 crore
- Enterprise value: ₹1,677 crore
- Terminal value as a share of the total: 74%
Three-quarters of the value comes from cash flows after year five. Every assumption you made about years one to five, taken together, explains about a quarter.
A small change, a large swing
The formula divides by the gap between the discount rate and the growth rate. In the base case, that gap is 7 percentage points. Narrow it to 6 and the terminal value rises by about a sixth. Widen it to 8 and it falls by an eighth. Because the gap is small, small changes in either input move the answer a lot.
Enterprise value (₹ crore) under different assumptions:
| WACC / Terminal growth | 4% | 5% | 6% |
|---|---|---|---|
| 11% | 1,733 | 1,963 | 2,284 |
| 12% | 1,511 | 1,677 | 1,898 |
| 13% | 1,338 | 1,463 | 1,623 |
Moving WACC by one point, with growth held at 5%, changes value by roughly -13% to +17%. Moving terminal growth by one point changes it by about -10% to +13%. Move both by one point and the range runs from ₹1,338 crore to ₹2,284 crore. The high end is 71% above the low end.
Now add debt. If the company has net debt of ₹500 crore, equity value in the base case is ₹1,177 crore. Across the same grid, it runs from ₹838 crore to ₹1,784 crore, or -29% to +52%. Debt stays fixed, so every swing in enterprise value lands fully on the shareholders.
None of these inputs is unreasonable. An analyst could defend any cell in that grid. That is exactly the problem: the model is precise in form but fragile in substance.
The hidden assumption inside the growth rate
Terminal growth is often treated as a free input. It is not.
A company can only grow if it reinvests. A useful link is: growth = reinvestment rate × return on invested capital. If a company earns 15% on new investment and wants to grow 5% forever, it must reinvest a third of its after-tax operating profit every year. That reinvestment reduces free cash flow.
Many models raise the growth rate without cutting free cash flow to match. That quietly assumes growth with no investment, which implies an infinite return on new capital. Check that the reinvestment in your final forecast year is consistent with the growth you assume after it.
Two more checks help:
- Terminal growth cannot exceed the long-run growth of the economy in the same currency. If it did, the company would eventually become larger than the economy. India's nominal growth is higher than that of developed markets, which tempts analysts to use high terminal rates. But a perpetuity covers many decades, and growth tends to slow as companies and economies mature.
- Translate the terminal value into a multiple. In the base case, the terminal value is 15 times year-five free cash flow. Ask whether a mature version of this business would plausibly trade at that multiple. The exit multiple method has the opposite weakness: it borrows today's market multiples and assumes they will hold years from now, which brings current market mood into a long-term value.
Limits of this critique
A large terminal value is not a flaw in the DCF. It reflects something true: most of the value of a going concern lies in its distant future. For a mature, stable company, a terminal value at 75% of the total or more can be entirely reasonable.
Extending the forecast to ten or fifteen years lowers the terminal value's share, and it is often worth doing for companies still growing fast. But it does not remove the assumptions. It spreads them across more years.
The real concern is not that the terminal value is big. It is that it gets the least scrutiny while carrying the most weight.
Habits for any DCF
- Report the terminal value share. If it is above 70%, say so plainly.
- Show a sensitivity grid for WACC and terminal growth, not a single point estimate.
- Check reinvestment against growth. Growth needs investment, and investment reduces free cash flow.
- Convert the terminal value into an implied multiple and test it against mature peers.
- Forecast until the business looks steady, not for five years out of habit.
- Run it in reverse. Start from the current market value and ask what terminal growth it implies. Then judge whether that is realistic.
The reframe
A DCF is mostly a statement about the distant future, dressed in the detail of the next five years. The detail is not the problem. Forgetting where the value actually sits is.
Sources
Figures and claims come from the sources named in the text and in the methodology note above: company filings, exchange disclosures, and rating agency reports, as cited. See the editorial philosophy for how sources are chosen.
Cite this article
Gajji, S. (2026). "Terminal value dominates valuations, and why that should worry you." The Valuation Node. https://valuationnode.com/analysis/financial-analysis/terminal-value-dominates-valuations
Related
How to Value a Company Using a Discounted Cash Flow Model
A step-by-step DCF walkthrough with one worked example: forecasting free cash flow, choosing a discount rate, terminal value, and value per share.
ValuationHow Small Changes in WACC Affect a Company's Estimated Value
WACC is built from estimates, not facts. How a one-point change moves value, and why growth companies feel it far more than mature ones.
ValuationHow to Integrate ESG Factors into a Company Valuation
ESG belongs inside the valuation, not as a separate score. Pick material issues, place them in cash flows or discount rates, and avoid double counting.
Discussion
Commenting as a guest. Add a name if you like, or leave it blank to post as Anonymous. Log in to comment as yourself.
Educational analysis, not investment advice. The author may hold positions in securities discussed; where relevant, this is stated above. See the disclaimer.
Stay in the loop
Roughly one email per month. No spam, no upsells.